I contributed to this project from late spring to early fall 2017 while working for my advisor, Professor Red Whittaker.
Overview
Gaseous diffusion plants have miles of piping for processing uranium hexaflouride. As part of ongoing deactivation and decommissioning work, these pipes need be be inspected to ensure that the volume of Uranium-235 is below a criticality incredible (CI) threshold. Manual inspection, with operators taking radiation measurements from outside of the pipe, has been employed, but the time, cost, and accuracy loss due to attenuation through pipe walls is substantial. We were approached to design a robotic method for inspecting these pipes using a volumetric measurement instead of radiological. Volumetric measurements, with assumptions of enrichment and density, can be back solved to compute U-235 content.
Our approach was to map pipe geometry and the deposit surface separately, thereby creating two maps constraining the possible deposit volume. To map the pipe, non-contact inductive proximity sensors were able to measure distances through deposits, while deposit surfaces were measured with optical triangulation sensors. These sensors were mounted on a spinning disk, generating helical point clouds as the robot drove down the length of the pipe.
As a veteran member of the team, I helped lead the project from initial proposal to deployment in radioactive pipes at the Portsmouth Gaseous Diffusion Enrichment Facility in Portsmouth, Ohio. I led the simulation, data analysis, and software/autonomy groups, while also mentoring and working on other aspects of the project. The schedule for this project was extremely fast paced, with project conception to first demonstration taking less than four months, and just an additional 6 weeks to develop a second system to deploy in “hot” pipes.
Simulation
Due to the tight time constraints, software and data analysis needed to develop in parallel with the mechanical and electrical design and robot construction. We created a simulation so that we could: test ROS drivers and nodes, have a data collection platform that was able to generate realistic data, verify the data collection and analysis pipeline, and have the ability to control the environment to create known ground truths for testing the data analysis methodology.

I led the creation of a Gazebo simulation, using ROS to control the robot motion and handle node message passing. We were able to create simulated inductive and optical proximity sensors in Gazebo with noise characteristics that roughly matched the actual sensors’ characteristics. This simulation ended up being used heavily to verify the volume estimation approach and to generate datasets before real world data was available.
Data Analysis
The pipe inspection robot was built to map, to sub-millimeter accuracy, the surfaces of the pipe wall and the deposits. These maps needed to be converted into a volume of deposit per foot to ensure U-235 concentration was below CI criteria. I developed the methodology behind moving from a point cloud representation of the pipe and deposit, to a volume of U-235 per unit length.
After the robot completes its data collection in a pipe, the data is moved to a post-processing computer that handles converting the point cloud data into deposit volume. Encoders in the wheels and spinning disc provide the relative transforms to a global coordinate system. The data is cut into 0.3 meter segments to iteratively calculate volume down the length of the measured pipe. These sections are then unwrapped into a coordinate system of radians, distance from measurement center, and translation distance along the pipe. Unwrapping the data allows for faster surface meshing, more intuitive visualization, and linear interpolations with respect to a radius measurement which maintains the assumption of smoothly varying deposits.
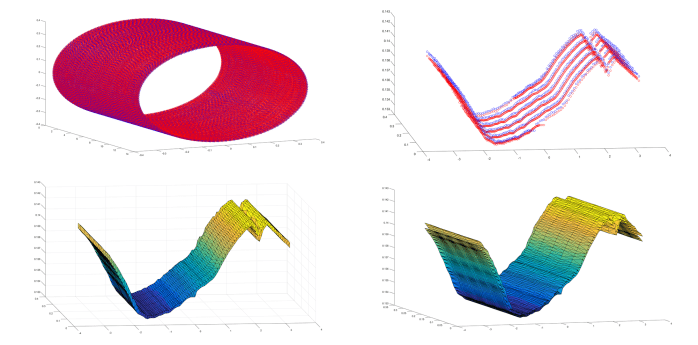
The pipe wall and deposit point clouds are separately projected onto a 2D plane and are meshed using Delaunay triangulation. Moving from 3D to 2D for triangulation reduces the time complexity from O(N^2) to O(N log N) which makes a substantial real time difference due to the density of our data.
After triangulation, the two surface meshes are joined to form a single watertight object whose volume can be computed. Surface normals are checked for uniformity, then signed volume tetrahedrons are generated for each triangle in the mesh. Summing these tetrahedrons gives the computed volume for the measured deposit. This method proved to be very accurate and fast when used on both simulated and real world data.
Autonomy
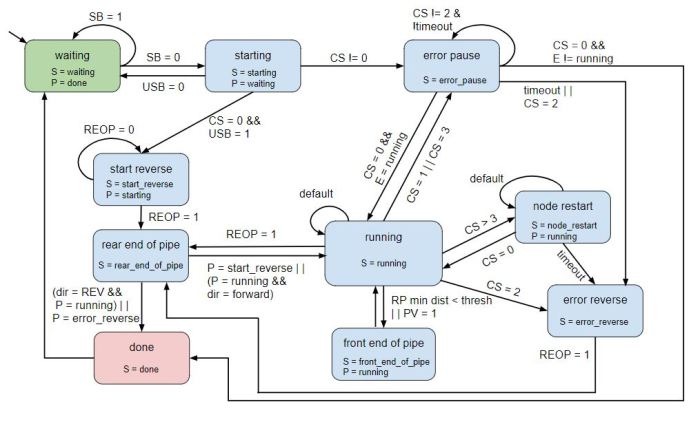
Due to security restrictions we needed to design the robot to be able to operate without using wireless control. The system had to be able to operate autonomously once given a signal to begin its run through a pipe. To handle this, the robot was outfitted with a number of peripheral sensors to monitor the robot’s surrounding. Three forward-facing laser range sensors check for large blockages that could be caused by closed valves, while three rear-facing sensors set the start of the run by noting when the robot fully enters the pipe, and also are used as a safety to stop the robot as it makes its way backwards through the pipe. Additionally, a laser scanner mounted on the nose of the robot uses 360 degree sweeps to determine if there is enough clearance for the high accuracy sensors to make it through the pipe, while also checking for gaps in the pipe or other issues that could potentially damage the system.

Sensor and actuation communication is handled using the Robot Operating System (ROS) framework running on an embedded computer. System logic, sensor drivers, and data processing was written in C++ to maximize data logging rates. A visual representation of the state machine that we created to convey the robot’s operation is shown here:
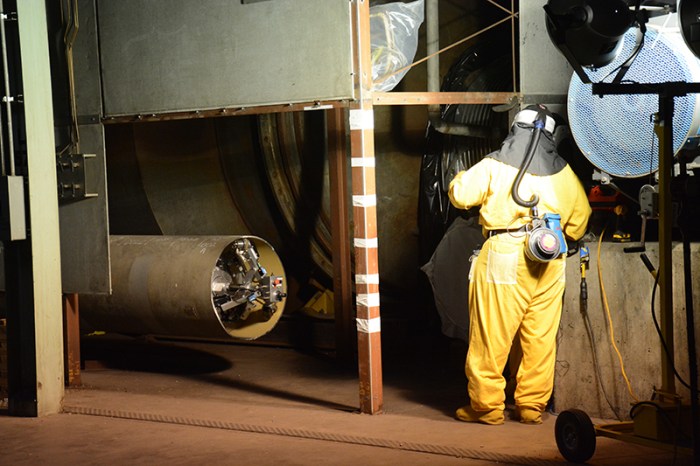
Hot Deployment
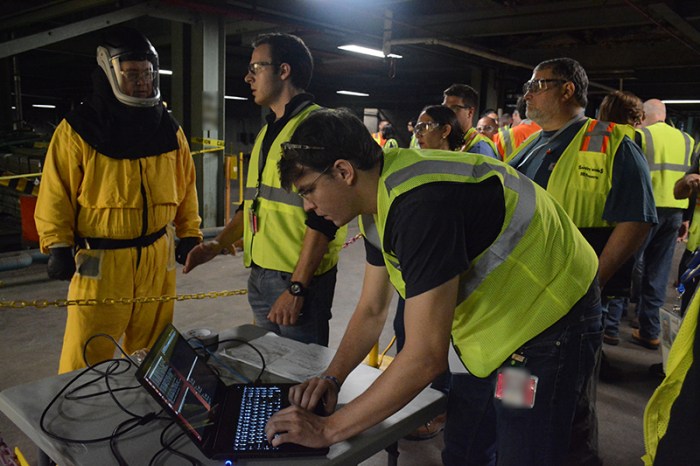
We deployed the robot at the Portsmouth facility in a series of pipes and demonstrated the robot’s ability to operate in the hazardous, radioactive conditions of a real uranium enrichment facility. Here, for the first time, we were able to capture visual and proximity data of the inside of the pipes. Within two weeks of our initial deployment, senior personnel at the Department of Energy, including the Secretary of Energy, were briefed on our work and accomplishments.